Developed in the 1980s by financial analyst John Bollinger, the bands appear on stock charts as three lines that move with the price. The center line is the stock price’s 20-day simple moving average (SMA). The upper and lower bands are set at a certain number of standard deviations, usually two, above and below the middle line. A stock’s position within the bands can help gauge the volatility of stocks and other securities to determine if they are over-bought or over-sold.
The bands generate signals by measuring market volatility, spotting breakouts during a “squeeze”, and highlighting relative overbought or oversold extremes.
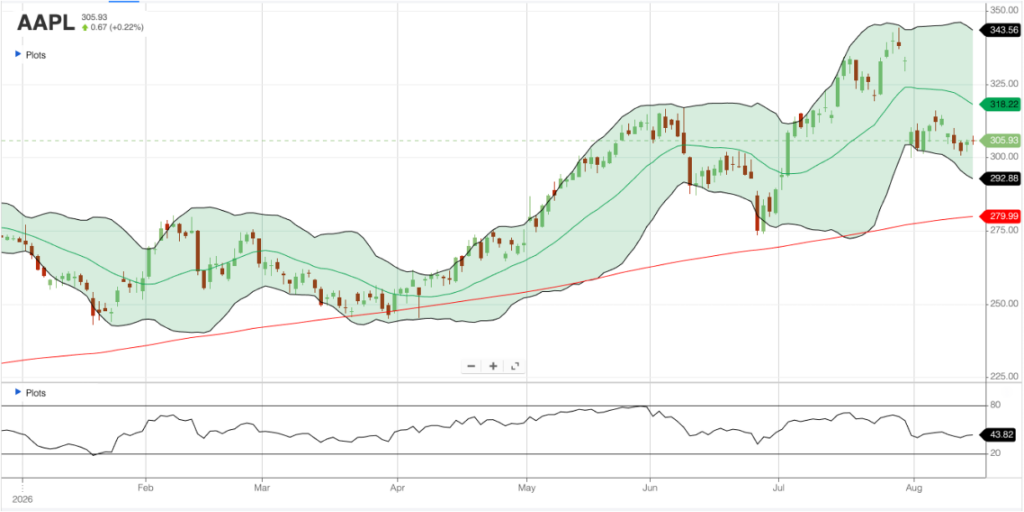
Bollinger Bands and the assumption of mean reversion work together on the idea that prices tend to return to their average. The mean reversion assumption is the statistical and financial theory that an asset’s price, volatility, or return will eventually move back toward its long-term average or mean over time. When extreme highs or lows happen, this view treats them as temporary overreactions that will correct themselves.
Core Principles of Mean Reversion
- Temporary Deviations: Market spikes and crashes push prices far from historical norms, but market forces pull them back.
- Dynamic or Static Mean: The “mean” can be a fixed historical average or a moving average that changes over time.
- Equilibrium Force: Think of the average like a magnet that exerts a stronger pull the further the price strays
How the Strategy Works
- Middle Band: A 20-period moving average acts as the core baseline or “mean” target for the price.
- Upper Band: Set +2 standard deviations above the SMA; touching it suggests an overbought condition and a short-selling opportunity.
- Lower Band: Set -2 standard deviations below the SMA; touching it suggests an oversold condition and a buying opportunity.
- The Reversion: Traders enter a trade when price rejects the outer band and target a return to the middle band.
Core Rules and Setup
- Market Conditions: Best used in sideways, range-bound, or quiet markets.
- Regime Filters: Avoid using mean reversion during strong trends, as prices can “ride” the outer bands continuously and cause massive losses. Use indicators like the Average Directional Index (ADX < 25) to confirm a lack of trend before entry.
- Entry Trigger: Wait for a price rejection or a reversal candle (such as a wick piercing the band followed by a close back inside) rather than blindly entering on a mere touch.
Riding the Bands (Trend Strength)
- What it looks like: Prices hug or “walk” directly along the upper or lower band during a strong market move.
- The signal: This shows powerful momentum, not an automatic reversal.
- How to trade it: Stay in the direction of the trend. Do not sell just because the price touches the upper band. [1, 2, 3, 4, 5]
Reversals at the Outer Edges
- What it looks like: Price spikes outside the outer band in a sideways or quiet market.
- The signal: It points to an overextended, overbought, or oversold state.
- How to trade it: Look for a candlestick confirmation pattern where price moves back inside the bands to signal a pullback toward the middle moving average line. Other technical indicators (see below) can also be used for confirmation.