The AI infrastructure boom creates an unusual problem for investors.
You may have identified exactly the companies you want to own—NVIDIA, Broadcom, Vertiv, Eaton, GE Vernova, Arista Networks and others—but many of these stocks can experience extraordinary runs as investors anticipate years of AI infrastructure spending.
The fundamental thesis may be excellent.
The entry price may not be.
This is where an empirical trading system can complement fundamental analysis.
The fundamental analysis answers:
What companies are eligible to own?
The trading system answers:
Under what empirical conditions is capital authorized to enter?
That distinction becomes particularly important when stocks are rising almost parabolically.
The Problem With Traditional Bollinger Signals
A conventional Bollinger Band strategy is often described approximately as:
Buy near the lower Bollinger Band.
Sell or trim near the upper Bollinger Band.
That can work reasonably well for a security exhibiting mean-reverting behavior.
It can be problematic for a stock in a powerful secular uptrend.
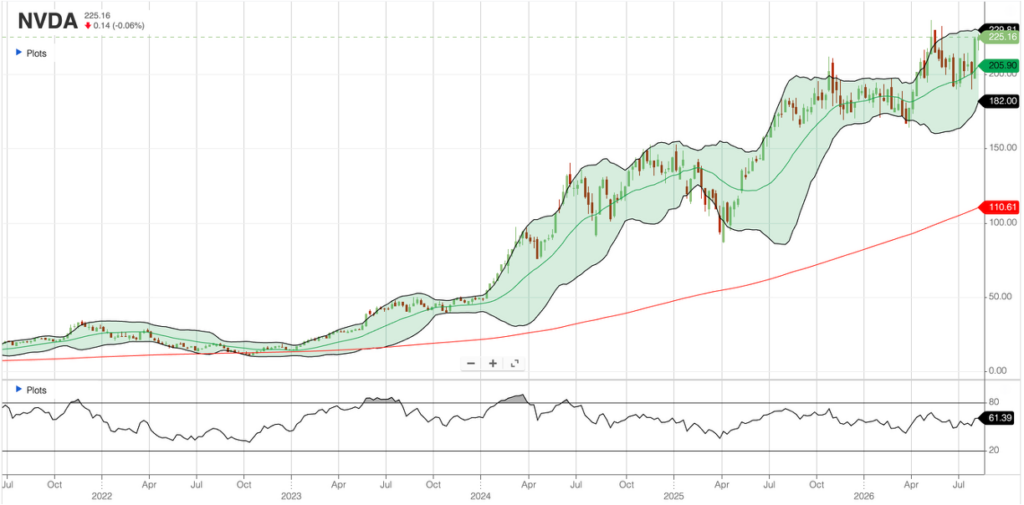
Strong momentum stocks can repeatedly touch—or even “walk”—the upper Bollinger Band for extended periods.
Selling simply because the stock reaches the upper band can therefore cause an investor to exit some of the strongest-performing stocks far too early.
At the same time, waiting for the stock to reach its lower Bollinger Band before buying may leave the investor waiting indefinitely.
The solution is not to abandon Bollinger Bands.
It is to interpret them according to the current market regime.
Three Market Regimes
A simple empirical trading system can distinguish between three conditions.
| Regime | Typical behavior | Trading policy |
|---|---|---|
| Range/Mean Reverting | Price oscillates around MA20 | Accumulate near lower band; trim near upper |
| Strong Uptrend | Rising MA20; repeated upper-band contact | Hold strength; buy controlled pullbacks |
| Trend Breakdown | Price loses MA20 and trend deteriorates | Stop automatically buying dips |
This changes the meaning of the Bollinger Bands.
In a mean-reverting market:
Upper Band → Potential Trim
In a strong uptrend:
Upper Band → Evidence of Strength
That does not mean buying indiscriminately at the upper band.
In fact, it can mean exactly the opposite.
Add an “Extended” State
Suppose a strong AI infrastructure stock has risen substantially above its 20-day moving average and is trading at or above its upper Bollinger Band.
The system could classify the stock:
EXTENDED — WAIT
This does not mean:
SELL
It means:
Excellent company. Strong trend. Poor entry point.
This distinction is important.
The empirical system doesn’t need to predict that the stock is about to fall.
It simply refuses to authorize new capital at an unattractive point in the price distribution.
Wait for the Pullback
Consider a hypothetical AI infrastructure stock that moves:
$150 → $165 → $185 → $210 → $230
During the advance, its MA20 rises from $155 to $190.
At $230, the stock may be substantially extended above its moving average.
Rather than chasing it, the system waits.
The stock subsequently moves:
$230 → $218 → $207 → $198
Meanwhile, the MA20 has risen to $195.
Now something interesting has happened.
The stock has corrected almost 14% from its high, but the underlying trend remains intact.
Price is approximately at MA20.
MA20 is still rising.
The longer-term trend remains positive.
Rather than interpreting the decline as bad news, the empirical system may now classify the stock:
PULLBACK — ACCUMULATE
The system has used volatility to improve the entry rather than attempting to predict the top.
A Possible Signal Architecture
For strongly trending stocks, a Bollinger-based system might use states such as:
EXTENDED
Price substantially above MA20 and/or above the upper Bollinger Band.
Action: Wait. Do not initiate.
TRENDING
Price above MA20, MA20 rising, trend intact.
Action: Hold.
PULLBACK
Price has retreated toward MA20 while MA20 remains positively sloped.
Action: Potential Accumulate.
DEEP PULLBACK
Price approaches the lower Bollinger Band while the broader trend remains intact.
Action: Potential stronger accumulation opportunity—but inspect why the decline occurred.
BREAKDOWN
Price falls through MA20 and trend characteristics deteriorate.
Action: Do not automatically buy the dip. Reassess.
This is considerably different from mechanically treating every lower-band touch as a buy and every upper-band touch as a sell.
Don’t Confuse Price With Thesis
This approach also separates two fundamentally different questions.
A stock falling from $230 to $198 does not necessarily mean the investment thesis deteriorated.
Likewise, a stock rising from $198 to $250 does not mean the investment thesis improved.
Price and business fundamentals are different signals.
For an AI infrastructure portfolio, the fundamental thesis might be driven by factors such as:
- Data-center capital spending
- AI accelerator demand
- Electrical infrastructure orders
- Power-generation demand
- Cooling requirements
- Backlog growth
- Hyperscaler capital-expenditure forecasts
The trading signal is driven by market behavior.
The two should interact, but they shouldn’t be confused.
Make the System Empirical
There is one final—and crucial—step.
Don’t assume that buying an MA20 pullback works.
Measure it.
For every stock in the AI infrastructure universe, record occurrences of:
- Lower Bollinger Band touches
- Pullbacks to MA20 during an established uptrend
- Upper-band breakouts
- Returns inside the band following a breakout
- MA20 breakdowns
Then measure subsequent:
5-day return
10-day return
20-day return
Over time, the system develops empirical evidence about what actually happens following each condition.
Perhaps MA20 pullbacks work extremely well for electrical-infrastructure companies but poorly for semiconductor stocks.
Perhaps upper-band breakouts in certain stocks predict further momentum rather than mean reversion.
Perhaps lower-band touches during a rising MA20 produce unusually favorable risk/reward.
We don’t need to speculate.
We can measure it.
Fundamentals Create the Backlog. Price Authorizes the Pull.
This produces a useful architecture for an empirical investment system.
Fundamental analysis identifies companies we would be comfortable owning.
The trading system monitors those companies continuously.
Price behavior determines when capital is authorized to enter.
Outcomes are recorded.
The results modify the trading policy.
The system therefore becomes:
Select → Observe → Signal → Act → Measure → Adapt
Rather than:
Predict → Buy → Hope
For a market experiencing an extraordinary secular investment cycle such as AI infrastructure, that may be the more useful application of Bollinger Bands.
The objective isn’t to predict the next correction.
It is to build a system that knows what to do when the correction arrives.