Building a Data-Driven Rebalancing Screen: Pullbacks, Overbought Stocks, and Capital Rotation
I recently extended my portfolio dashboard with a new Rebalance Candidates screen designed to identify potential opportunities for capital rotation across multiple portfolios.
The idea grew out of a simple question: if “time in the market beats timing the market,” can technical indicators still be useful for deciding where incremental capital should be deployed—or where existing positions may warrant trimming?
The objective is not to predict short-term market movements. Instead, the dashboard identifies securities trading at relative extremes and presents them as candidates for further review.
From Pullback Screening to Rebalancing
The original screen identified Pullback Candidates using Bollinger Band %b together with the stock’s position relative to its 200-day moving average.
Bollinger %b normalizes the stock’s position within its Bollinger Bands:
%b = 0.00corresponds approximately to the lower Bollinger Band.%b = 0.50corresponds approximately to the 20-day moving average.%b = 1.00corresponds approximately to the upper Bollinger Band.- Values below 0 or above 1 indicate movement outside the bands.
The pullback rule is:
%b ≤ selected pullback threshold AND PDMA200 > 0
PDMA200 measures the percentage distance between the current price and the 200-day moving average.
Requiring PDMA200 to be positive helps distinguish a pullback within a longer-term uptrend from a stock that may simply be declining below its long-term trend.
Adding the Other Side of the Trade
The next step was to identify stocks at the opposite extreme.
An Overbought Candidate is currently defined simply as:
%b ≥ selected overbought threshold
For example, a stock with %b = 1.06 is trading above its upper Bollinger Band. That does not automatically mean the stock should be sold. It means the position may deserve review as a potential source of capital.
This creates two complementary groups:
Pullback Candidates — potential destinations for incremental capital.
Overbought Candidates — existing positions that may warrant review for trimming.
The dashboard therefore becomes less about finding isolated trading signals and more about supporting capital allocation and portfolio rebalancing decisions.
For example, rather than asking, “Should I buy CSCO because it has pulled back?” the more useful question might be:
“Does it make sense to trim an extended position such as AAPL and redeploy some of the proceeds into a high-quality stock currently experiencing a healthy pullback?”
The dashboard identifies the candidates. The investor still makes the allocation decision.
Configurable Thresholds
Rather than hard-code the definition of a pullback or overbought condition, the Rebalance Candidates modal provides two interactive dropdown controls:
Pullback ≤ [0.20]
Overbought ≥ [0.80]
The thresholds can be changed in 0.10 increments.
For example, changing the pullback threshold from 0.20 to 0.10 immediately narrows the list to more extreme pullbacks. Increasing it to 0.30 or 0.40 progressively broadens the candidate universe.
Likewise, the overbought threshold can be moved from 0.80 toward 0.90, 1.00 or higher to isolate increasingly extended stocks.
The filtering occurs directly in the browser, so changing a threshold does not require another call to the Google Apps Script server.
Cross-Portfolio Screening
The screen does not operate on just the portfolio currently displayed in the dashboard.
Google Apps Script scans the Calc sheets associated with all active portfolios and returns the relevant technical data to the browser.
The Rebalance Candidates modal currently displays:
Portfolio | Ticker | Price | Change % | PDMA200 | %b | RSI14 | VRatio
This provides useful context beyond the screening condition itself.
For example, RSI14 can help determine how short-term momentum relates to the Bollinger position, while VRatio provides information about current trading volume relative to normal volume.
Simple Visual Classification
I deliberately avoided adding another set of signal badges.
Instead, the candidate rows are color-coded:
Green rows identify pullback/accumulation candidates.
Red rows identify overbought/trim-review candidates.
Stocks in the middle of the selected Bollinger range are not displayed at all.
The result is a compact screen showing the two tails of the distribution—the securities potentially worth accumulating and those potentially worth reviewing as sources of capital.
Separating Screening from Decision-Making
An important design principle is that neither classification constitutes a trading instruction.
A low %b does not mean “Buy.”
A high %b does not mean “Sell.”
Instead, these conditions answer a narrower and more defensible question:
Which positions currently deserve attention?
That distinction is important. Technical indicators are being used as a screening and decision-support mechanism rather than as an automated prediction engine.
Toward Data-Driven Accumulation
This also suggests an interesting alternative to conventional “buy the dip” strategies.
Waiting indefinitely for a market decline creates an obvious conflict with the principle that time in the market beats timing the market.
An alternative is to invest continuously while using pullbacks to influence the allocation or rate of incremental investment.
In other words:
Don’t wait for a dip. Invest continuously, but use statistically attractive pullbacks to help determine where additional capital should go.
The Rebalance Candidates screen provides the beginnings of a control mechanism for implementing that idea.
Instead of trying to forecast the market, the system continuously observes current conditions, identifies relative extremes, and presents potential capital-allocation decisions for review.
That is a much closer fit with the overall philosophy behind the portfolio dashboard: use data to improve the quality and consistency of decisions rather than attempting to predict the future.
Using RSI14 and VRatio as Supporting Indicators
The Rebalance Candidates screen also displays RSI14 and VRatio, even though neither indicator is currently part of the primary screening rules.
This is deliberate.
The primary conditions remain simple:
Pullback Candidate: %b is below the selected threshold and PDMA200 is positive.
Overbought Candidate: %b is above the selected threshold.
Once a stock appears on the screen, however, RSI14 and VRatio provide additional context that can help assess the character of the move.
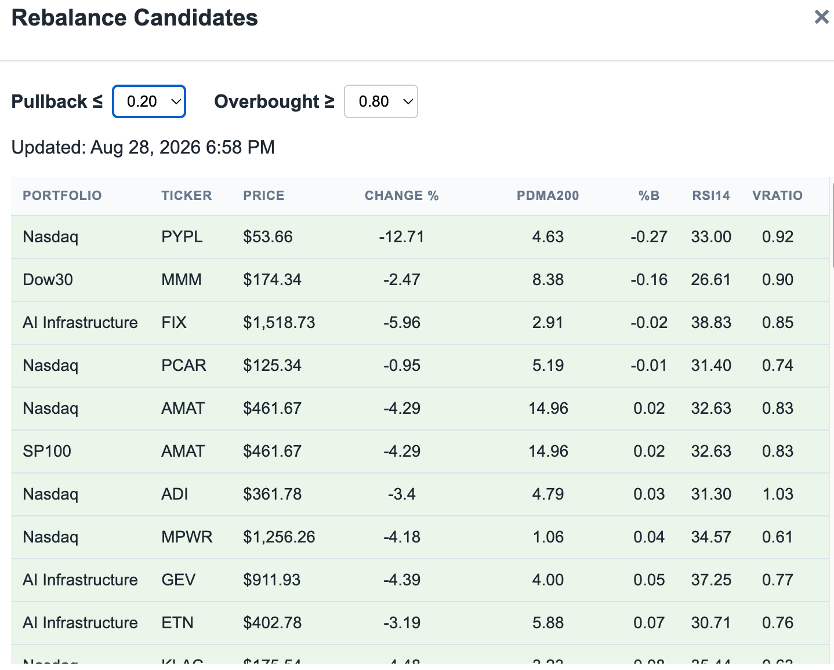
RSI14 provides a measure of short-term momentum. For a pullback candidate, a relatively low RSI can provide additional evidence that the stock has experienced meaningful short-term selling pressure. Conversely, a high RSI on an overbought candidate can reinforce the observation that the stock has become extended.
RSI should not be interpreted mechanically. A strong stock can remain at an elevated RSI for an extended period, just as a declining stock can remain oversold. Its role here is to provide supporting evidence rather than generate another Buy or Sell signal.
VRatio provides another dimension by comparing current trading volume with normal volume. It can help distinguish a relatively quiet price movement from one accompanied by unusually heavy market participation.
For example, a pullback occurring on relatively modest volume may represent a very different market condition from a sharp decline accompanied by exceptionally high volume. Similarly, an overbought stock advancing on unusually strong volume may deserve a different interpretation from one drifting upward on light volume.
The intended workflow is therefore:
%b identifies the extreme. PDMA200 establishes longer-term trend context for pullbacks. RSI14 and VRatio help interpret what is happening underneath the price movement.
This maintains an important separation between screening and decision-making. The system identifies situations worthy of attention; the supporting indicators provide additional evidence; and the investor decides whether the evidence is sufficient to justify a change in capital allocation.